Discussion of slavery, voting and
African-American rights in South Jersey
There are several indicators that South Jersey opposed slavery to a far greater degree than did North Jersey and that this was consistent over a considerable time-period:
1) The slavery rates
(percentages of the black population enslaved)
were much lower in South Jersey during the first three generations of the life of the nation (1790 to 1860). At the beginning of this period
92.6% of New Jersey's enslaved people were in the northern counties.
By 1840 it was over 99%.
2) The
1860 popular vote for Lincoln
in the Southern Counties as a whole was 55%, but was only 45% in the Northern Counties.
3) The vast majority of legislators from South Jersey were in
full support of the US Constitutional Amendments
abolishing slavery and guaranteeing civil and voting rights of African-Americans. The opposite was the case in North Jersey.
4) Of the 13 South Jersey Assemblyman voting on an
1863 bill to exclude out-of-state African-Americans from becoming NJ residents
, only one voted "yes" (8%). In North Jersey the "yes" votes were 32 out of 40 (80%).
5) Once they were free to do so, the African-American people "voted with their feet!" While in the period from 1800 to 1870 the
percentage of the total State population that was African-American
dropped steadily from 8% to 3.4%, the percentage in the southern counties rose from 4.7% to 6.1%.
During this same time the percentage of northern counties' population that was African-American dropped drastically from 9% to 2.5%.
(see
note 10
below)
In 1790 almost 84% of New Jersey's African-American population was in the northern counties, almost all enslaved.
By 1870 New Jersey's African American population was much more evenly split: 57% in the north, 43% in the south.
The idea that South Jersey was more opposed to slavery than North Jersey may seem counter-intuitive to some. Some residents occasionally say "South Jersey was below the Mason-Dixon line" in a way that seems to imply that racism is more to be expected here. The statistics indicate the contrary.
(note: The Mason-Dixon line ends along the western border of Delaware and does not involve New Jersey at all).
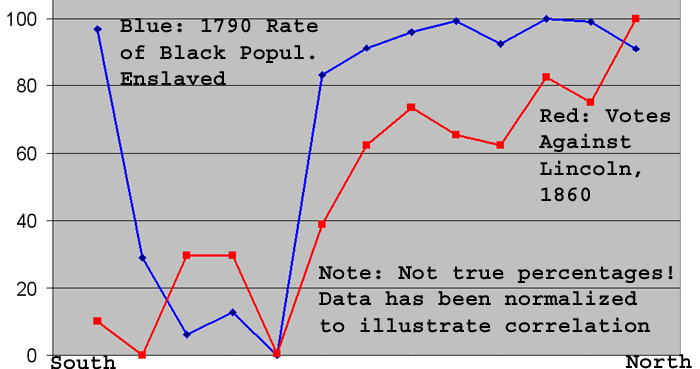
The following graph presents the Counties (or County groups) from the southernmost on the left, to the northernmost on the rightThe blue (mostly higher) line represents the percentage of the black population that was enslaved in each county or county group in 1790. The red line represents the percent of the anti-Lincoln vote in 1860.
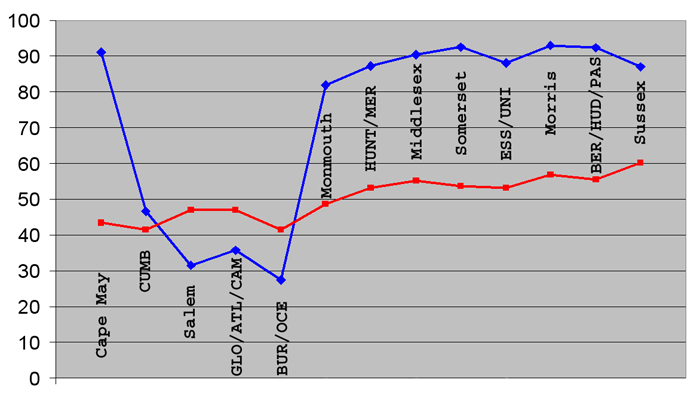
The percent correlation for these two data sets is 70%. The correlation is seen even more clearly
if the data sets are normalized to use the full scale.
If Cape May is excluded from the calculation the correlation is 85%. The Cape May data presents an "out-lier": this is probably because its early founders were migrants from heavily-Puritan New England, Long Island, and North Jersey and hence the attitudes toward slave-holding were more similar to those in North Jersey. Cumberland also had a high percentage of New England/Calvinist settlers and its rate of black enslavement was South Jersey's next highest at 46.51%.
The actual population and voting numbers in Cape May were rather small, but the percentage of the total population that was of African descent (6%) was higher than in the other South Jersey counties (which averaged 4.4%). As tourism from the south slowed to a stop with the war, and improved transportation brought more population from the northwest, Cape May probably assimilated culturally more with the rest of South Jersey (then known as West Jersey; see
note 8
below). It is possible that there were fewer economic opportunities for free black people in Cape May where the agricultural society was dominated by relatively few families.
Notes:
1) Counties and County groups are grouped roughly from South (left) to North (right), though there were parts of old Gloucester County, (which included both Camden and Atlantic), which were north, and parts that were south, of Salem County. The arrangement on this graph tried to reflect the centers of population in those groups, but this is only approximate.
2) The county groupings were made as above because in 1790 the second and third counties listed in each group had not yet been established and so are listed with their "parent" county when that was possible. In some cases a county had multiple parent counties and for these cases the groupings were made by geographical and cultural affiliation with North or South Jersey. For instance, Ocean was formed from the southern part of Monmouth County, but this was populated largely by Quakers from Burlington and centered around the community of Little Egg Harborwhich had been in Burlington (Little Egg Harbor itself was transferred to Ocean County in the late 1800s). Mercer County was formed from parts of Burlington, Hunterdon and Middlesex but has been grouped here with Hunterdon.
3) The voting percentages shown are the 1860 vote for the Democratic/Fusion party candidate: Stephen Douglas. Since there were multiple candidates whose votes contributed to this slate (Douglas, Breckenridge, Bell), it is appropriate to think of it as the "anti-Lincoln" ticket.
4) Though the percentage of the popular vote in South Jersey was nearly 56% for Lincoln there were nearly three times the number of voters in North Jersey, so the state as a whole was the only "Northern" state that did not have a popular vote for Lincoln.
5) A complicated circumstance made New Jersey the only state to split its electoral vote in 1860. According to
Michael J. Dubin
: "The Fusion slate consisted of three electors pledged to Douglas, and two each to Breckinridge and Bell, resulting in lower totals for them and a split electoral outcome. The three Douglas electors were elected and four of those pledged to Lincoln. The Breckinridge and Bell electors finished behind all other candidates."
6) The voting pattern was similar in 1864 when the vote for Lincoln in South Jersey counties was 55%; in North Jersey 44%.
7) The slavery statistics above are derived from
Appendix 3 of
Afro-Americans in New Jersey: a short history
. Giles R. Wright; Trenton, NJ, New Jersey Historical Commission, 1989.
The voting data is derived from Dubin, Michael J.,
United States presidential elections, 1788-1860 : the official results by county and state
, Jefferson, N.C. : McFarland & Co., c2002, [LoC: JK524 .D778 2002 Alc; ISBN: 0786410175]
8) It may be anachronistic to use the term "South Jersey" for the time-period before the Civil War. Naming conventions for businesses and newspapers of the day indicate that the area still thought of itself as West Jersey. The first such use of the term "South Jersey" known to the author is from 1863: the "South Jersey Republican" newspaper. For more on this topic, click
here: West Jersey Consciousness.
9) The percentage of the total population that was of African descent in 1790, per county, is:
For South Jersey:
|
|
|
6.0 |
Cape May Co
|
|
5.2 |
Salem
|
|
4.5 |
Burlington
|
|
4.0 |
Gloucester
|
|
3.1 |
Cumberland
|
For North Jersey:
|
|
|
19.78 |
Bergen
|
|
15.92 |
Somerset
|
|
11.52 |
Monmouth
|
|
9.14 |
Middlesex
|
|
7.48 |
Essex
|
|
7.40 |
Hunterdon
|
|
4.22 |
Morris
|
|
2.58 |
Sussex
|
10) The phrase "voted with their feet" may imply that the change in percentages was primarily due to African-Americans living in North Jersey moving to South Jersey in significant numbers. I know of no data that would be able to confirm this implication. Certainly a lot of African-Americans moved from the southern states to the northern states in the decades after the Civil War, but the declining percentages in North Jersey counties may have had more to do with larger numbers of immigrants of ethnicities other than African-American moving into North Jersey.
Home (westjersey.org)
Site Map
This site maintained by
Bob Barnett.
Last updated: 2023 Tenth Month, 19th.
|